From 28 October to 3 November 2026 Germany sat through a dunkelflaute: wind and solar covered only 22 percent of electricity use, and a net 617 gigawatt hours came from abroad, purchases worth 178 million euros at the German exchange price. A megawatt hour cost 265 euros on average, more than in any lull since 2024, even though this was not the deepest one. The biggest price driver was gas at around 100 euros, not imports.
As of 4 November 2026.
More on this topic: Battery Storage & Energy, with background, practice and every article in one place.
Dunkelflaute Now: The Key Points
- 22 percent: the share of electricity use covered by wind and solar from 28 October to 3 November 2026. In all of 2025 it was 44 percent.
- 617 gigawatt hours: net imports in seven days, 6.7 percent of consumption. Germany was a net buyer in 82 percent of all quarter hours.
- 265 euros per megawatt hour: the average exchange price of the week, against 108 euros from January to September 2026.
- 100 euros: the mark European gas passed on 28 October 2026 for the first time since 2022. Compared with before the war, that lifts the cost of a gas plant by about 140 euros per megawatt hour of power.
- 4.1 gigawatts: the capacity of the three nuclear plants shut in April 2023, on paper more than the net imports, but worth less than a tenth of the price.
- 5.2 gigawatts: firm capacity of new gas plants that won awards on 3 November 2026. They must be running by 2031 at the latest.
Dunkelflaute Now: What Happened From 28 October to 3 November
The wind went first. Of about 83 gigawatts of installed wind power, an average of 7.8 gigawatts was running during the week, and of a little over 120 gigawatts of solar, 4.3 gigawatts. On Sunday 25 October a megawatt hour still cost 13 euros on the power exchange as a daily average, four days later 315 euros. The most expensive quarter hour came on 29 October from 17:15 at 574 euros. Berliner Zeitung reported the jump, and customers on dynamic tariffs saw it at once: according to agrarheute, Tibber customers paid up to 90 cents per kilowatt hour on 29 October. How such tariffs work is explained in Dynamic Electricity Tariff 2026.
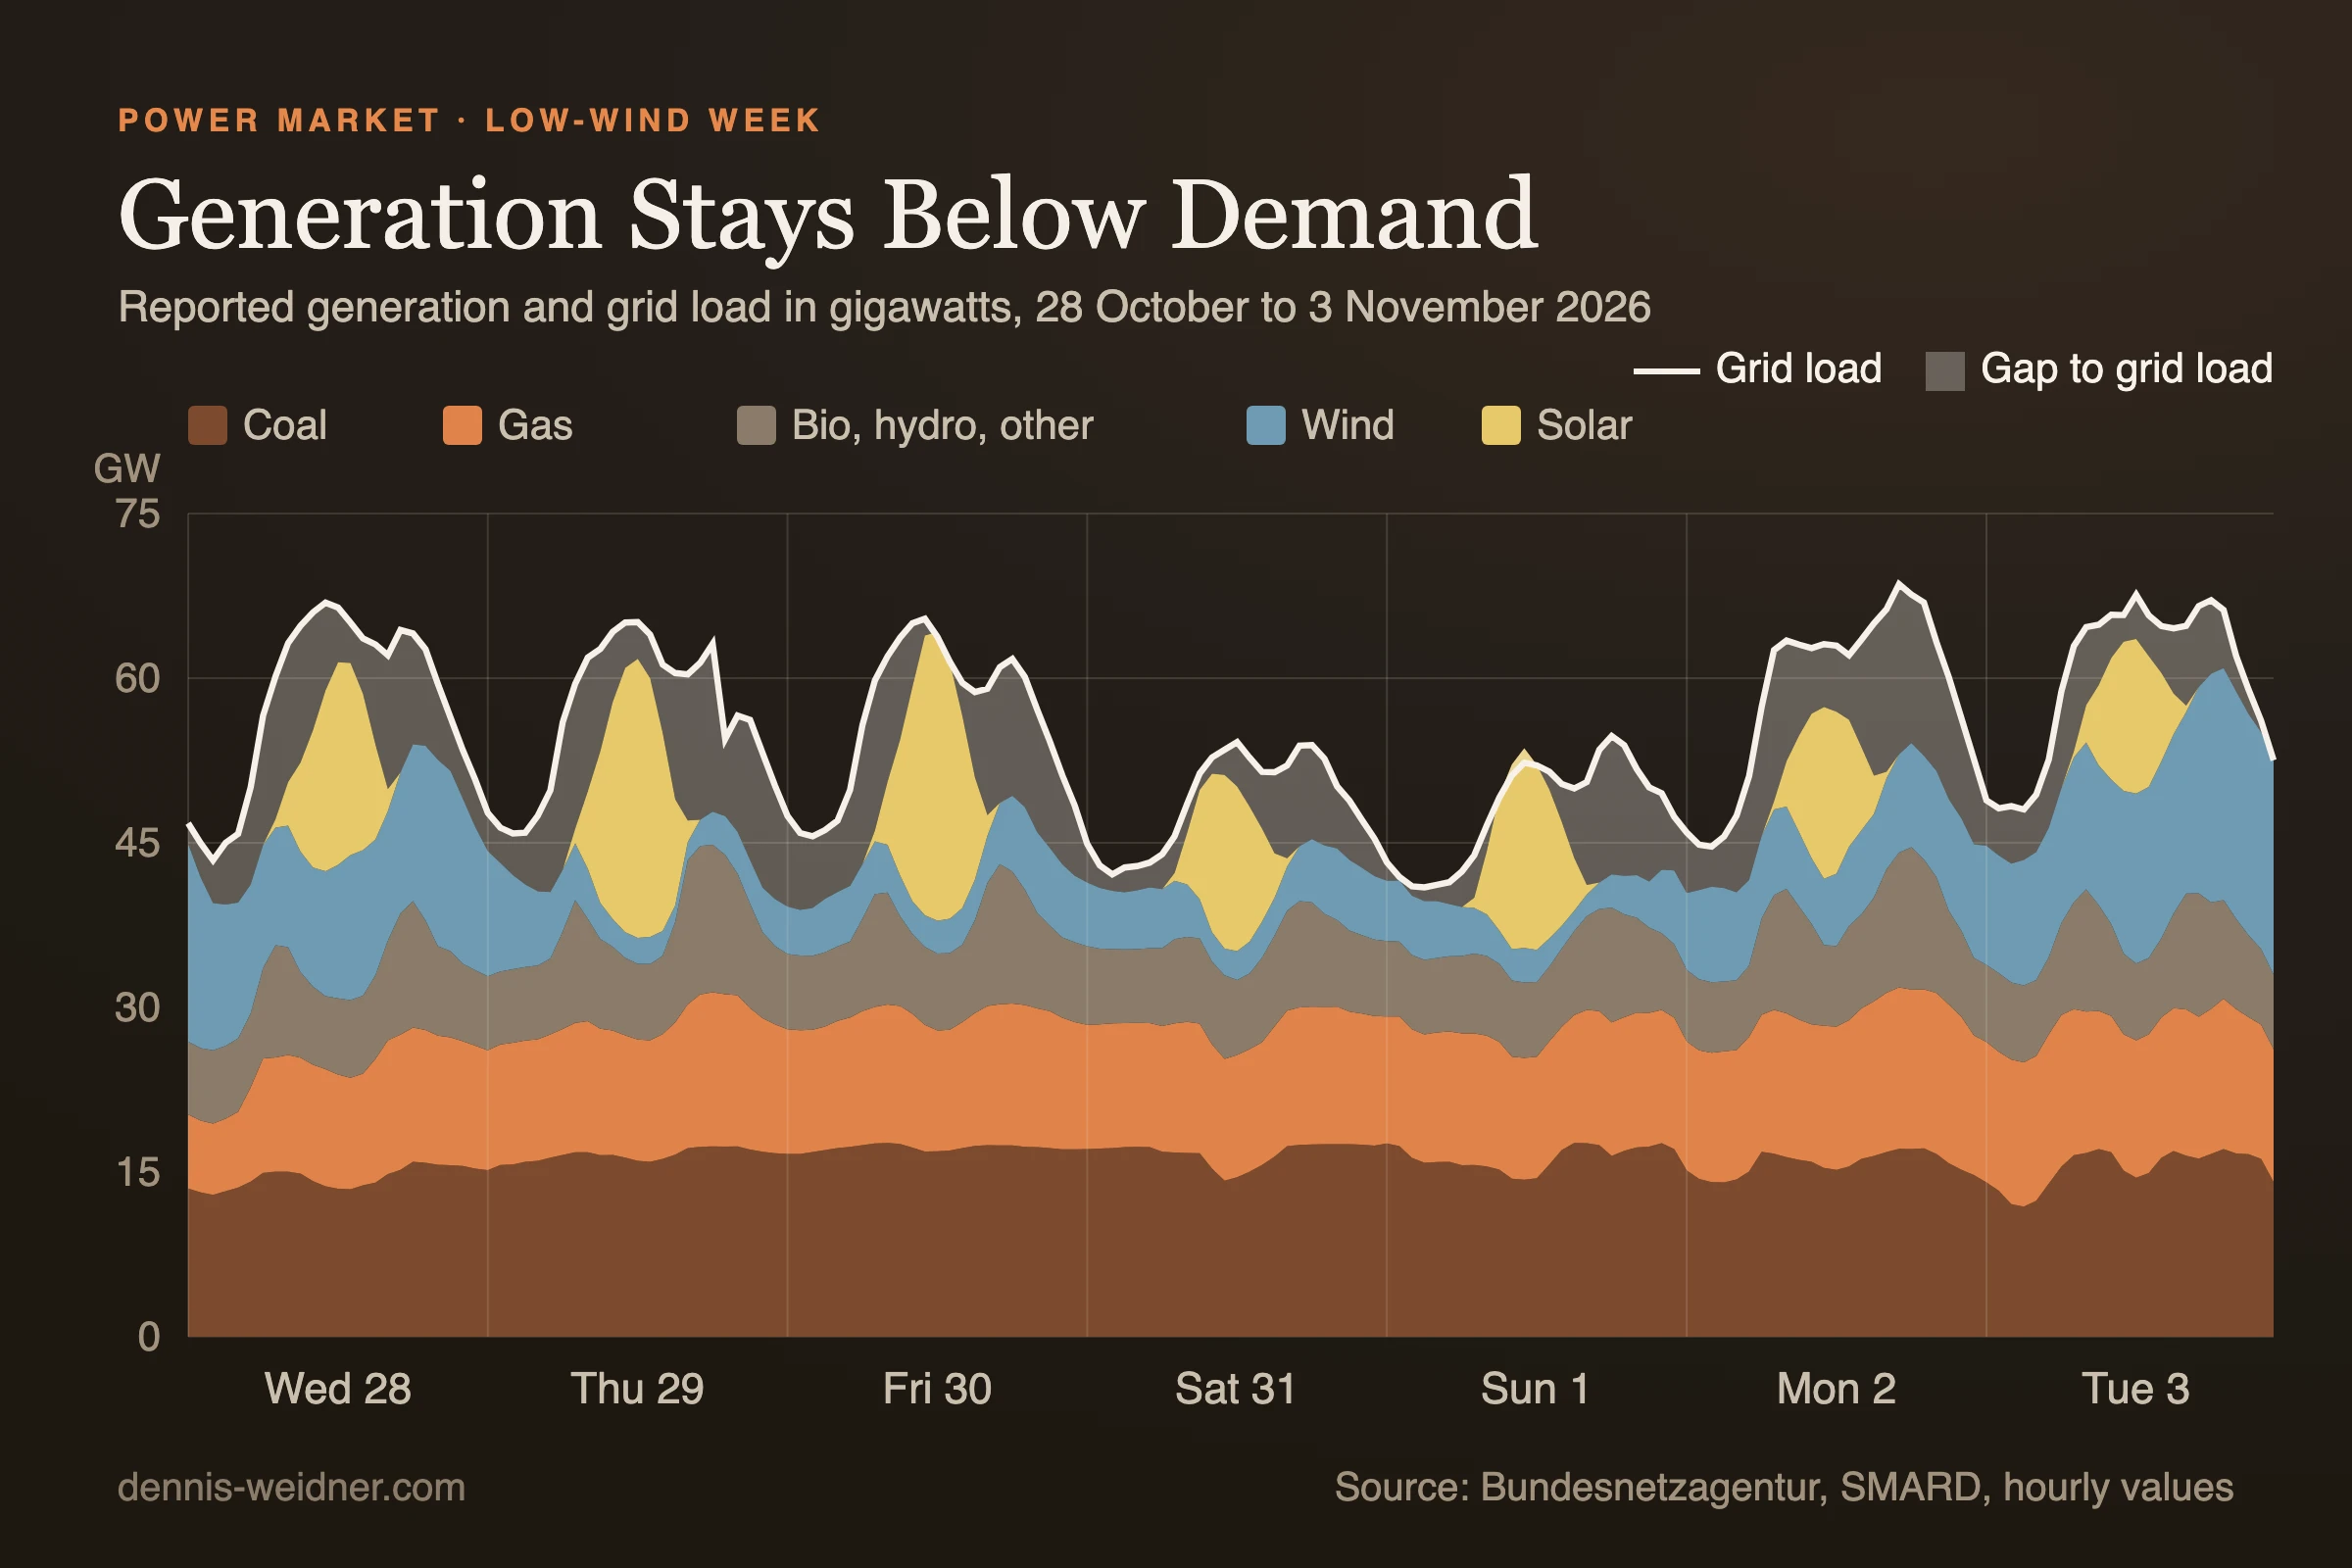
Coal and gas carried the week: lignite and gas each supplied 21.7 percent of consumption, hard coal 7.4 percent and biomass 7.5 percent. Grid load rose to 69 gigawatts on 2 November at 17:15. On 4 November the wind returned, with the forecast on SMARD at about 17 gigawatts. The exchange price still stayed high at 249 euros.
Can Germany Still Cover Its Power Demand? Electricity Imports in Numbers
Not from its own generation this week, but the purchases are smaller than many charts suggest. Between grid load and reported generation there was a gap of 12.3 percent. The trade balance with the neighbours, as shown by Fraunhofer ISE on Energy-Charts, came to 617 gigawatt hours or 6.7 percent. The rest is mainly generation that does not appear in the statistics, for example from smaller units and industrial plants.
On average a net 3.7 gigawatts flowed into the country, peaking at 11.4 gigawatts in exactly the quarter hour of highest grid load. At the German exchange price the net purchases cost 178 million euros. That is a little over 7 percent of the exchange value of the week's entire consumption, 2.47 billion euros. What is expensive is mainly the power itself, not its route across the border.
| Country | Trade balance with Germany | Average exchange price |
|---|---|---|
| France | 354 GWh to Germany | €249/MWh |
| Netherlands | 335 GWh to Germany | €262/MWh |
| Denmark | 230 GWh to Germany | €256 to €265/MWh |
| Norway | 221 GWh to Germany | €192/MWh (southern Norway) |
| Belgium | 90 GWh to Germany | €259/MWh |
| Germany | 617 GWh net imports | €265/MWh |
| Austria | 275 GWh from Germany | €281/MWh |
| Poland | 143 GWh from Germany | €264/MWh |
| Czech Republic | 103 GWh from Germany | €275/MWh |
| Luxembourg, Switzerland, Sweden | 93 GWh from Germany | €262 to €281/MWh |
The table shows how European power trading works. Germany mostly bought where power was cheaper in a given quarter hour and at the same time passed power on to Austria, Poland and the Czech Republic. Almost everywhere the price was close to the German one, because the lull and the gas price hit everyone. Over a full year Germany does not depend on imports either: according to the Bundesnetzagentur net imports were 21.9 terawatt hours in 2025, and from 1 January to 3 November 2026 the balance is nearly even at minus 0.3 terawatt hours.
Why the Power Price Is So High in This Dunkelflaute: Gas and the Iran War
Because expensive dispatchable plants set the price and their fuel costs more than at any time since 2022. On the day-ahead market the most expensive plant still needed sets the price for everyone. In a dunkelflaute that is almost always a gas plant. According to ORF, the European TTF gas price rose above 100 euros per megawatt hour on 28 October. Before the Iran war it stood at about 30 euros, says Trending Topics, and German gas storage was about 61 percent full at the end of October, against about 75 percent a year earlier.
The arithmetic is simple. A modern gas plant with 55 percent efficiency needs about two megawatt hours of gas for one megawatt hour of power, counted in the unit gas is traded in. At 100 euros that is about 200 euros, plus about 33 euros for CO₂ at a permit price of about 90 euros. Together about 235 euros before the plant earns a cent. At a gas price of 30 euros it would be about 95 euros. The gas price alone therefore explains about half of the 265 euro exchange price. Older plants with 40 percent efficiency end up at a little over 320 euros, and that is where the evening hours were.
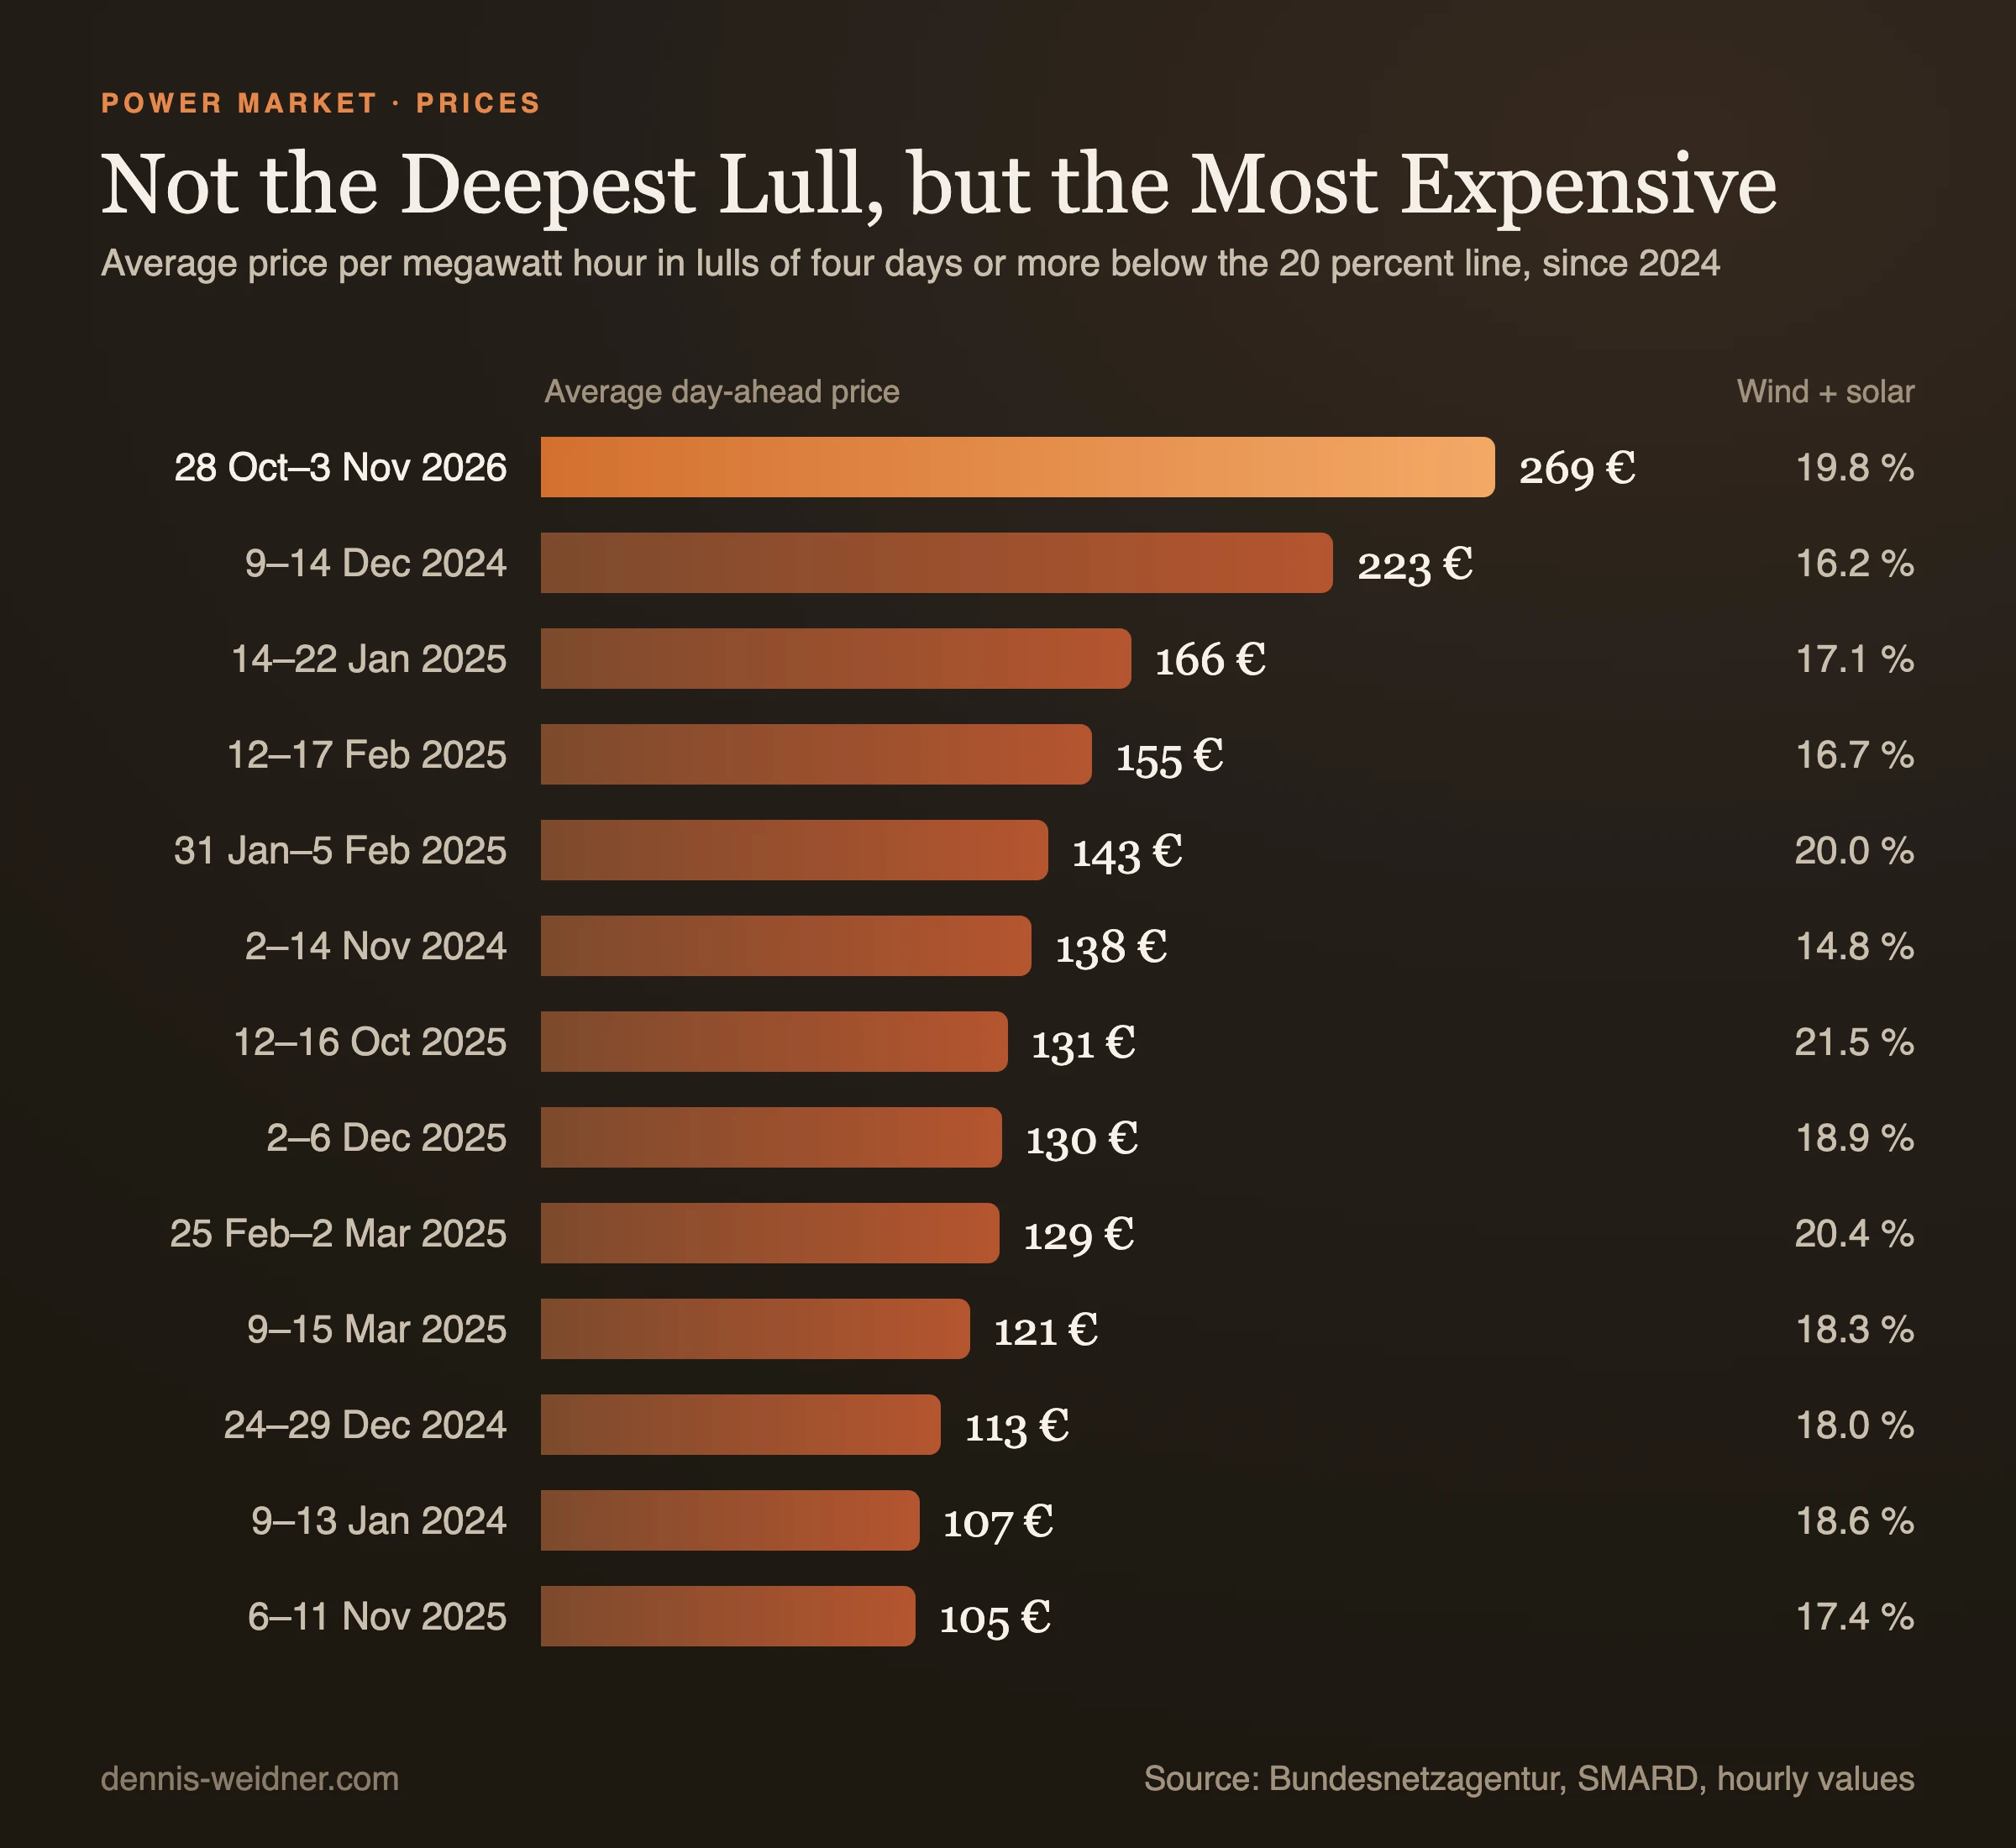
The comparison makes it clear. In the lull from 6 to 11 November 2025 wind and solar covered even less, 17.4 percent, and a megawatt hour cost 105 euros. This time it was 19.8 percent and 269 euros, a little over two and a half times as much. Gas plants did not run more than usual: an average of 12.2 gigawatts, against 12.7 gigawatts in the twelve earlier lulls. The same amount of gas simply costs far more.
Would Nuclear Plants Have Absorbed the Dunkelflaute? The Numbers on the Nuclear Exit
This week's purchases on paper yes, the price only to a small degree. Isar 2, Emsland and Neckarwestheim 2 went off the grid on 15 April 2023, together 4.1 gigawatts. At full output that would have been 681 gigawatt hours in seven days, more than the 617 gigawatt hours of net imports. With the three units shut at the end of 2021 it would have been 8.1 gigawatts. Anyone who says that with these reactors Germany would not have been a net buyer this week is right on paper, provided they ran at nearly full output around the clock. At the peaks it would not have been enough: in just under half of all quarter hours net imports were above 4.1 gigawatts.
It would have changed the price less than the debate suggests. This week each gigawatt of residual load moved the hourly price by about 4 to 6 euros on average, depending on whether the outlier day of 29 October is included. As a rough estimate, 4.1 gigawatts would have pushed the price down by about 18 to 23 euros, or 7 to 9 percent, and 8.1 gigawatts by about 36 to 47 euros. At about 140 euros, the gas price weighs several times as much. The plants cannot be brought back anyway: according to the federal government's answer of August 2026, all three are being dismantled.
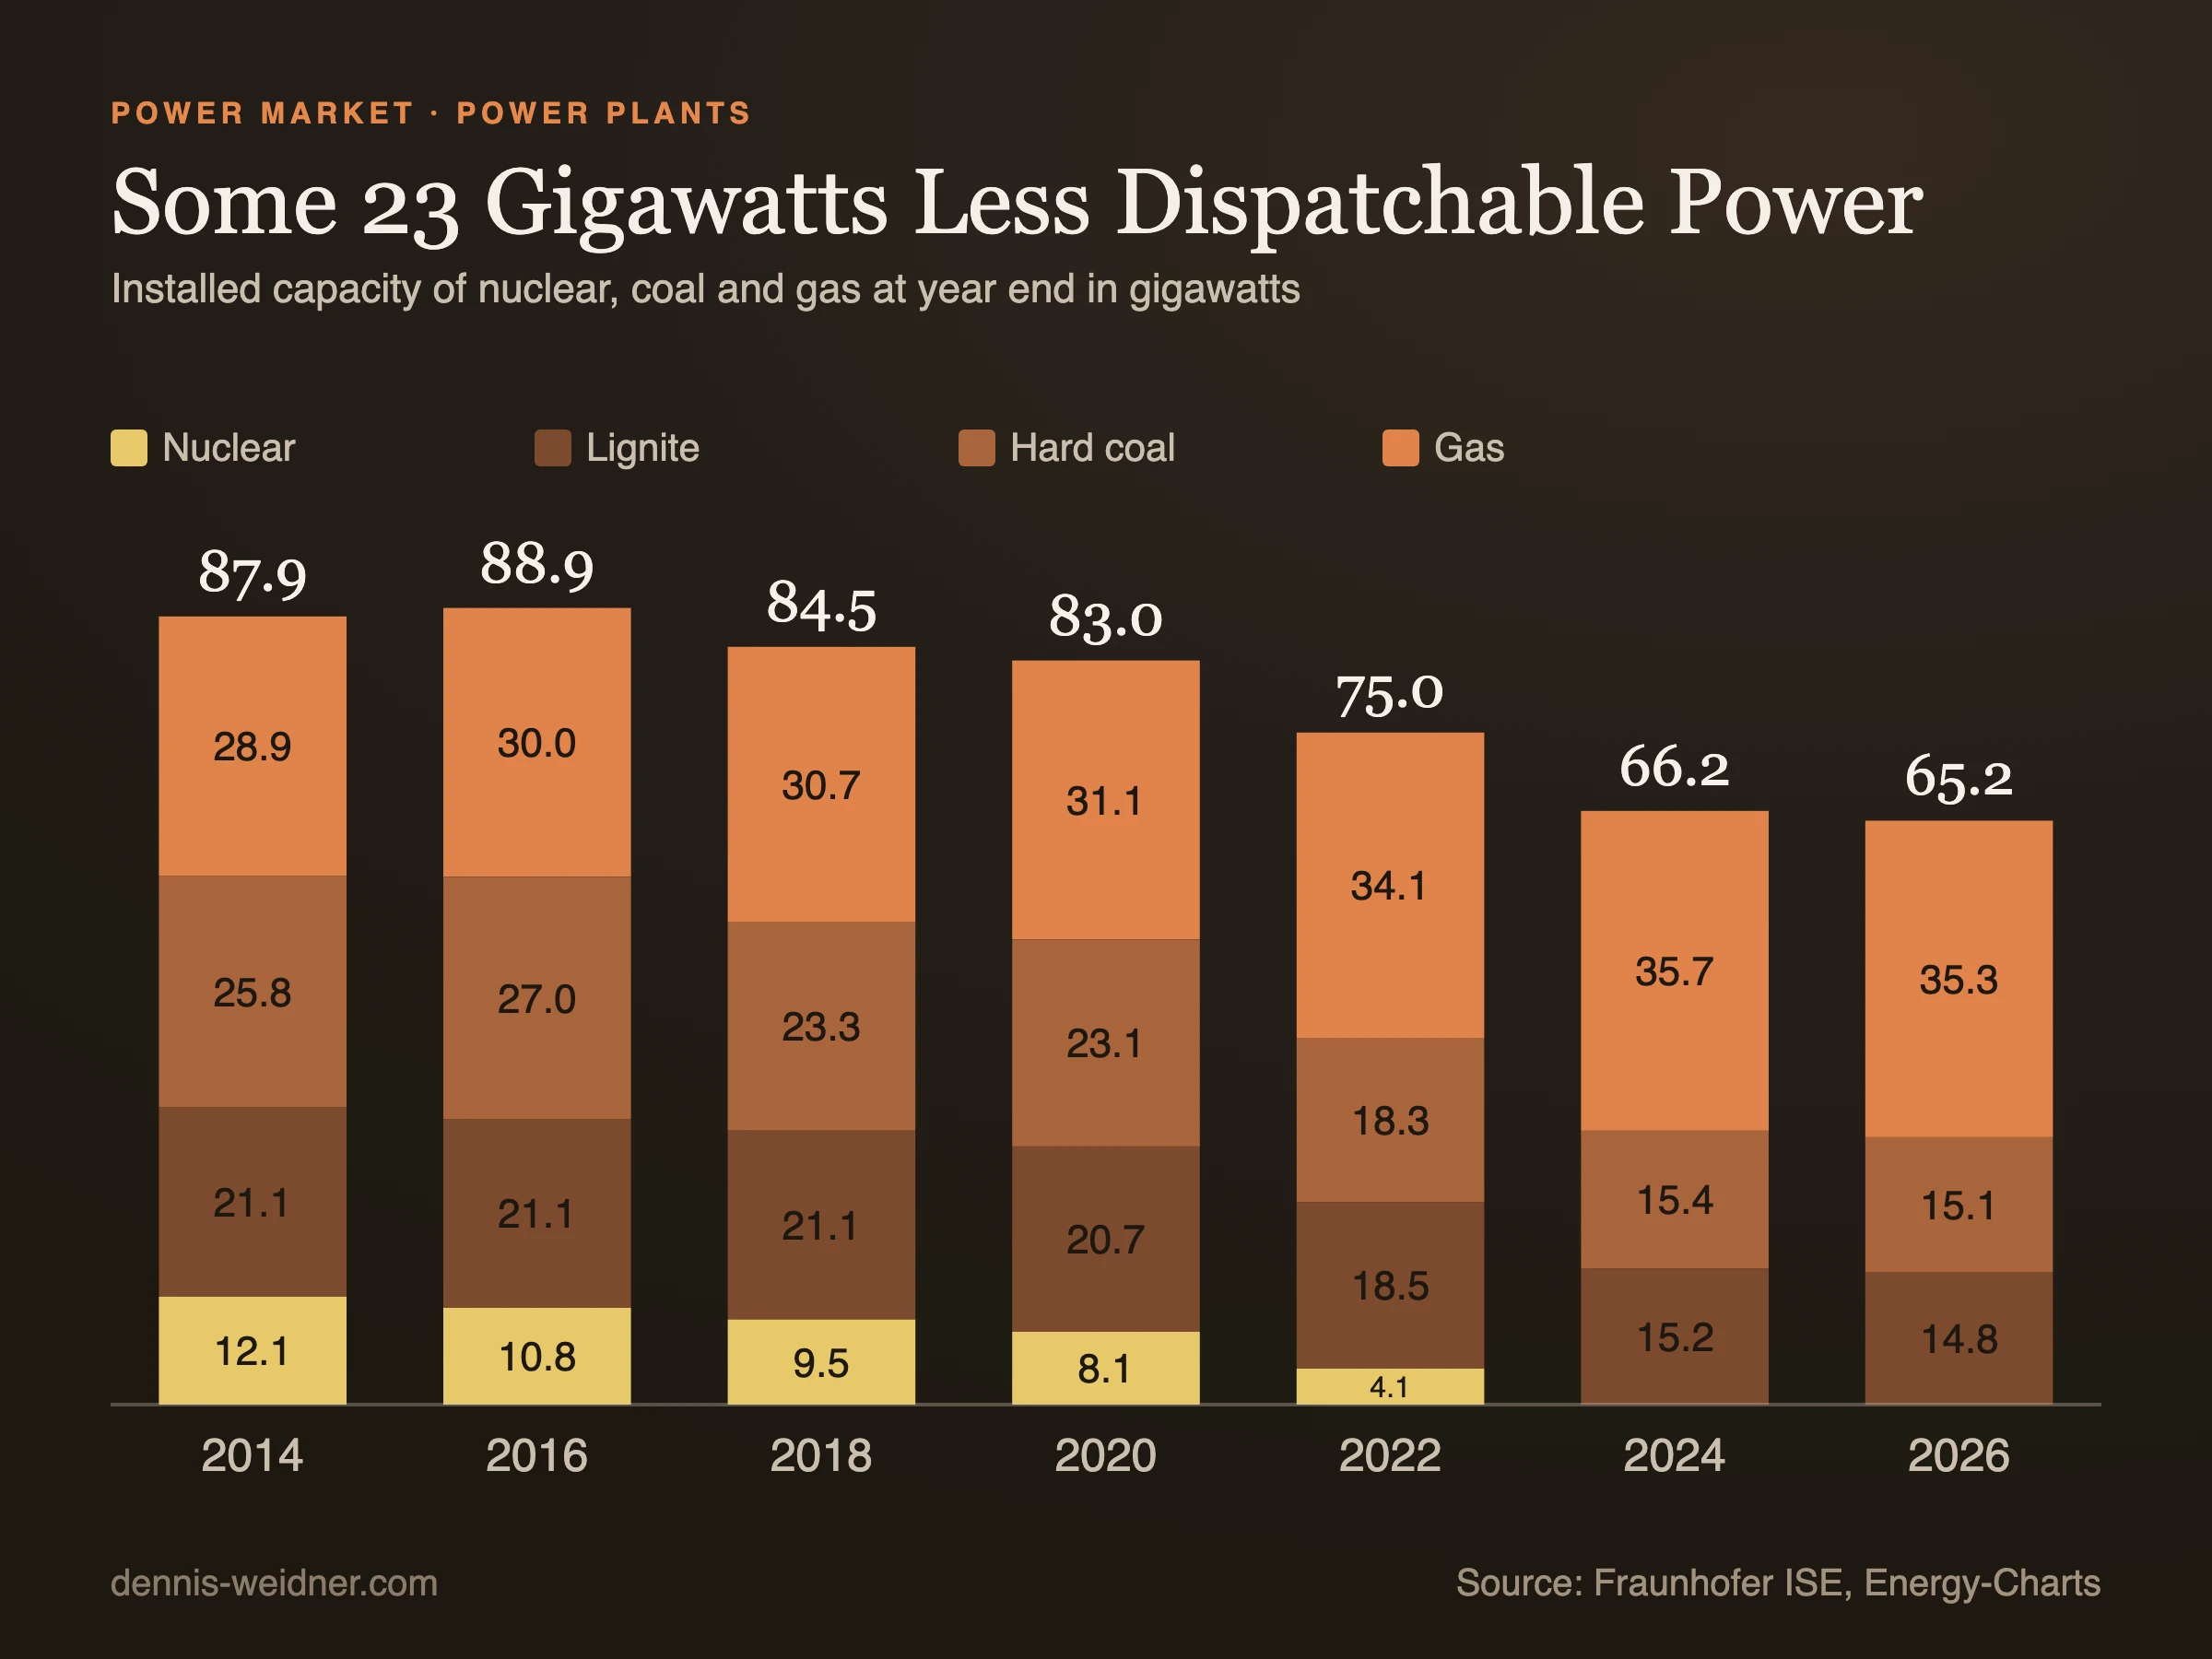
That does not settle the debate. Since 2014 a combined 22.8 gigawatts of dispatchable capacity from nuclear, coal and gas has disappeared: minus 12.1 from nuclear, minus 10.7 from hard coal, minus 6.3 from lignite, plus 6.4 from gas. Batteries have added 22 gigawatts, but they only last for hours, and new firm replacement capacity so far exists mainly on paper. My conclusion: the order was wrong, shutting down first and ordering replacements afterwards. In weeks like this that makes Germany more dependent on the gas price and on its neighbours than it needs to be. This week's bill was still written mainly by a war. Keeping the two apart makes for a better debate about what to do now.
What Is a Dunkelflaute? Definition and Yardsticks
A dunkelflaute is a weather pattern in which wind and solar deliver hardly any power for days. The German word combines darkness (Dunkelheit) and a lull in the wind (Windflaute). It hits the weather-dependent renewables, wind and solar; hydro and biomass keep running but cover only a small part of demand. No law defines it, but the Bundesnetzagentur does: in its investigation of price spikes of October 2025 it counts periods of at least 48 hours in which wind and solar continuously deliver less than 15 percent of their installed capacity. Add frost and people speak of a cold dunkelflaute: wind and sun are then missing on exactly the days when heating drives power demand up.
An older yardstick comes from the German Weather Service. In 2018 it looked at how often wind and solar delivered less than ten percent of their rated capacity on average over 48 hours. According to the DWD notice, that happened about 23 times a year for onshore wind, 13 times for onshore and offshore together, twice with solar added and 0.2 times a year on a Europe-wide view. So the frequency depends on the definition and the fleet. The more solar is installed, which according to the Bundesnetzagentur's expansion figures has the largest capacity and delivers little in winter, the more often a line based on rated capacity is crossed. With a little over 200 gigawatts of wind and solar, the agency's threshold now sits at about 30 gigawatts. This analysis therefore also measures against power demand.
How Often Does Germany Have a Dunkelflaute?
Depending on the yardstick, between about 500 and 1,400 hours a year, mainly in the winter half. With the Bundesnetzagentur's definition and installed capacity at year end I count eight periods with 952 hours for 2024, 14 with 1,409 hours for 2025 and so far ten with 938 hours for 2026. The week from 28 October clearly counts, with 154 hours.
Looking at demand is stricter. The basis is the hourly data from SMARD, the Bundesnetzagentur's power market platform, from 1 January 2024 to 3 November 2026. Counted is any period of at least 48 hours in which wind and solar covered less than 15 percent of electricity use on average. That is a third of normal: over the year they reached 43.3 percent in 2024 and 44.4 percent in 2025.
The result: 529 such hours in 2024, 684 in 2025 and none so far in 2026. The current lull stayed just above the line, its lowest 48-hour window at 16.7 percent. That is partly down to expansion, because even on dull days over 120 gigawatts of solar bring noticeable power around noon. At a line of 20 percent it clearly counts.
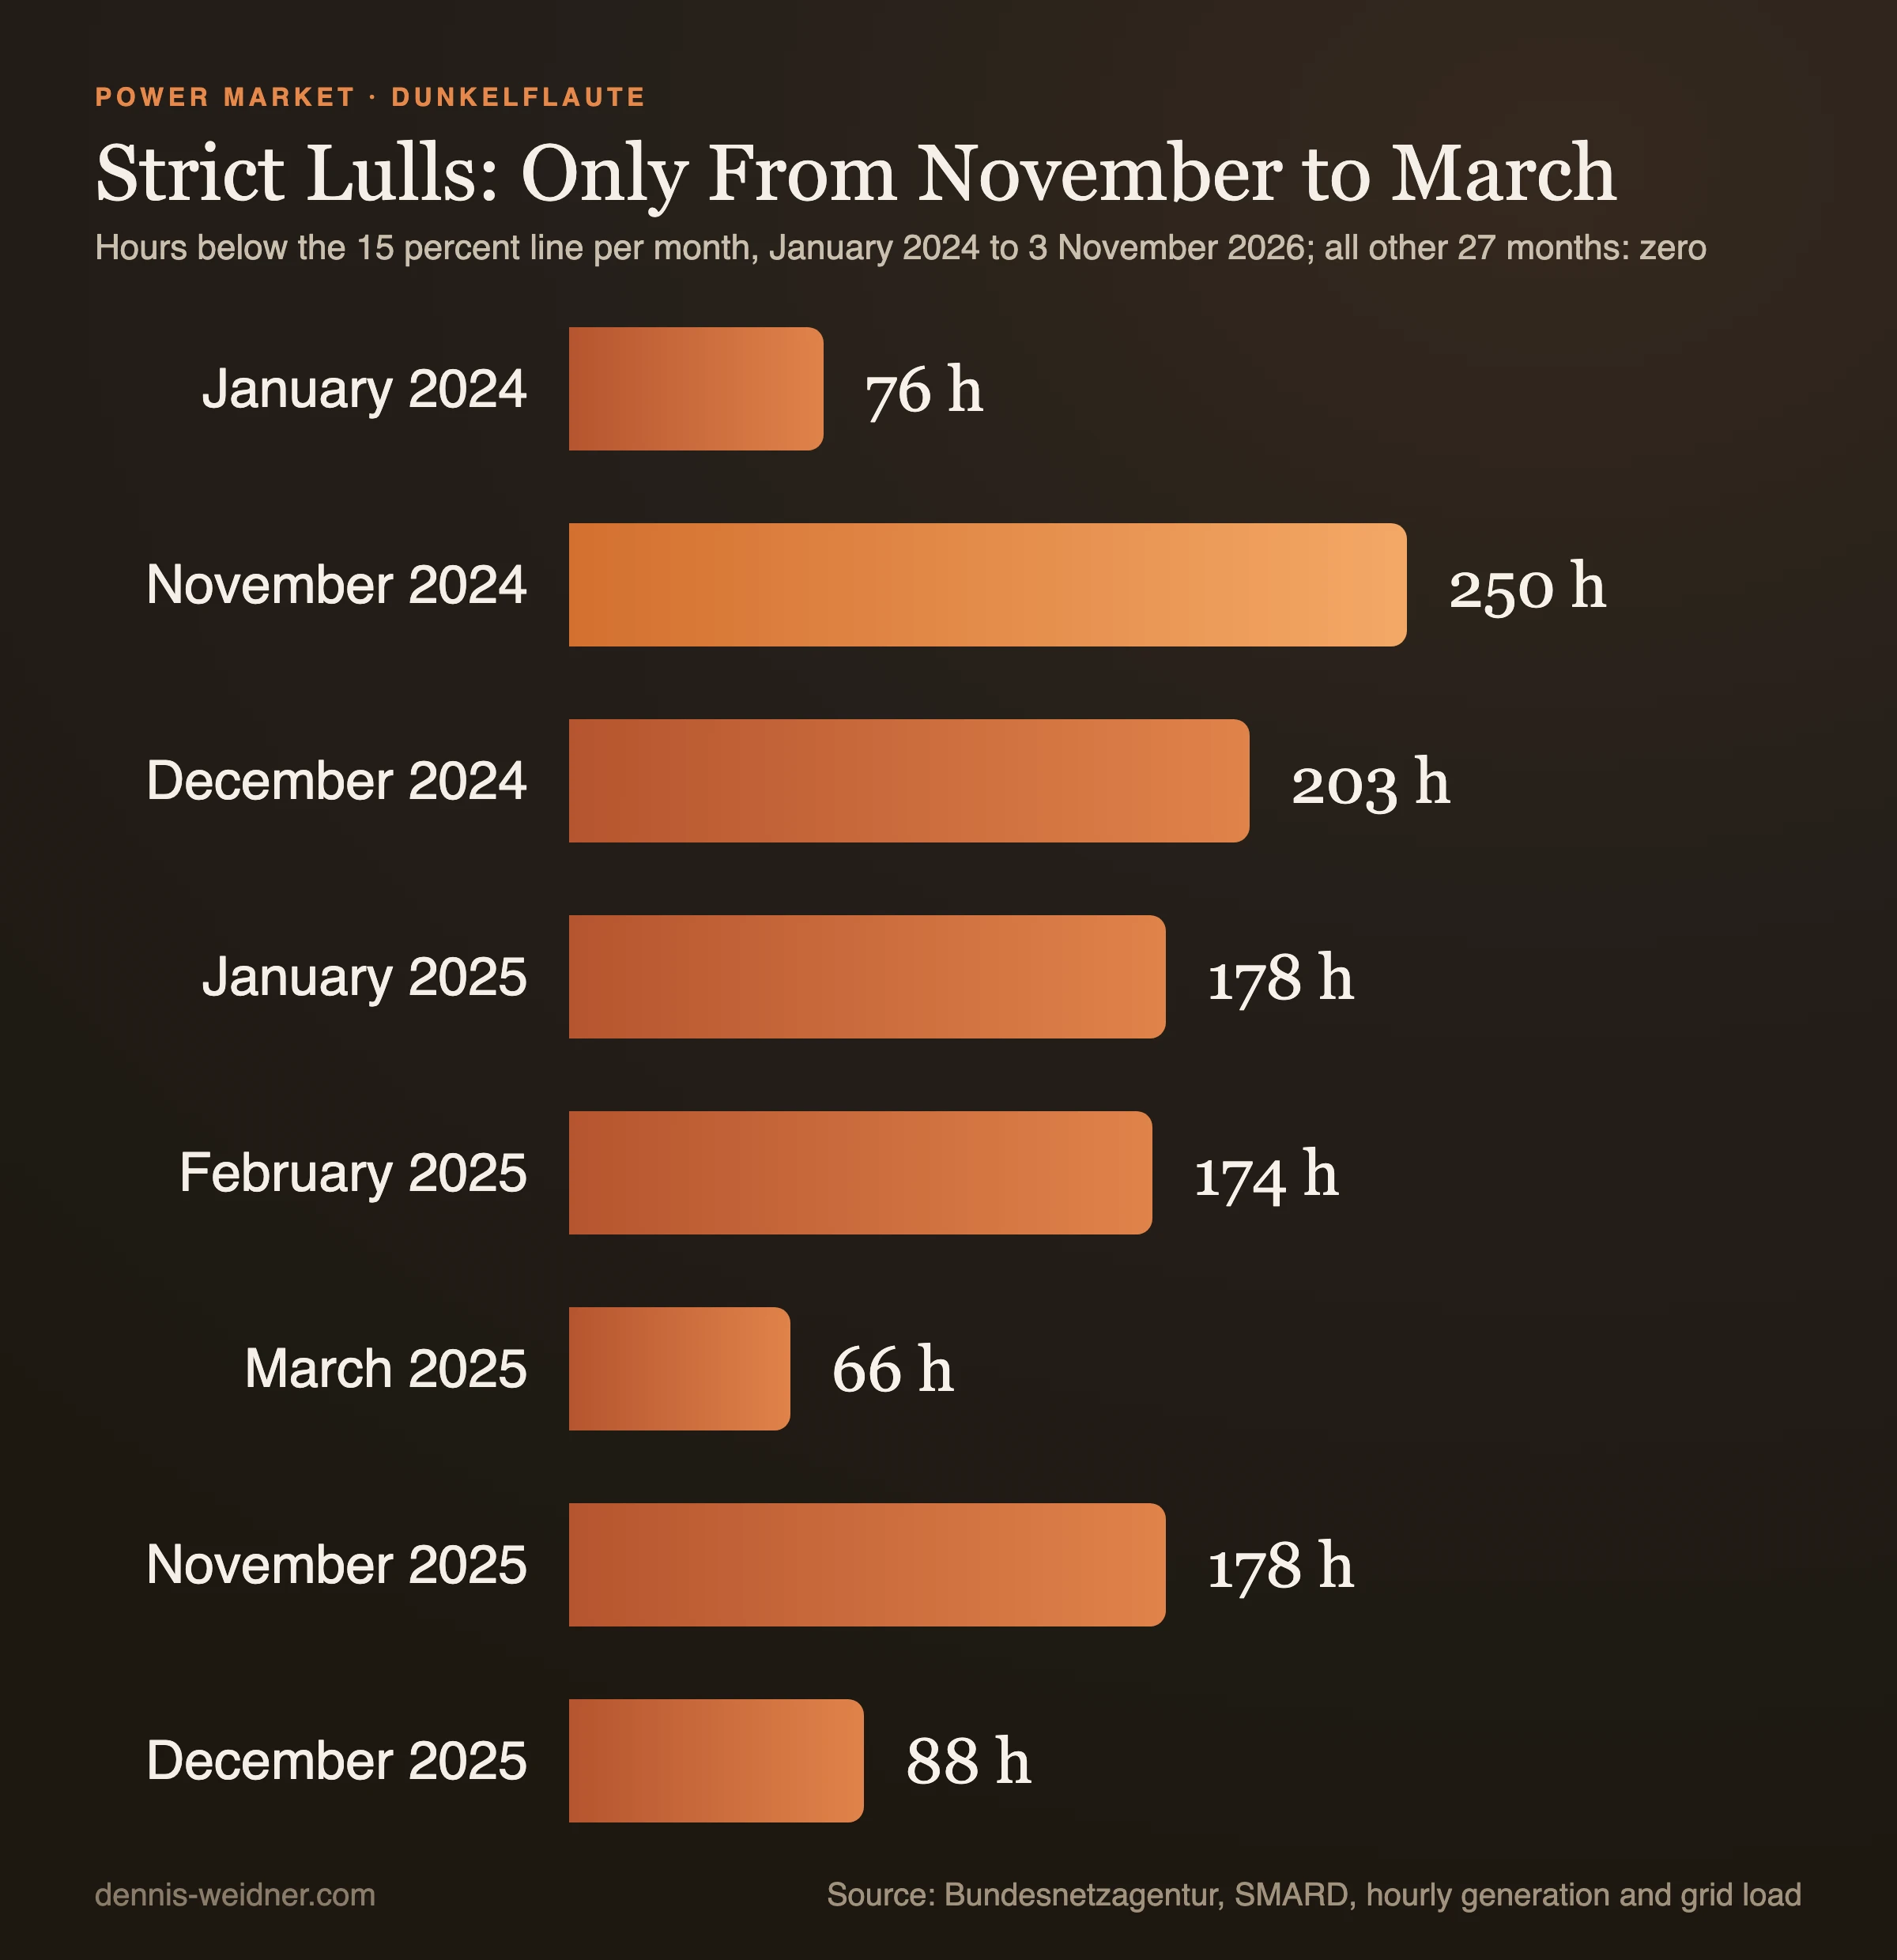
Winter 2025/26 was much calmer than the one before. About 870 hours in winter 2024/25 were followed by 266, and after 6 December 2025 no hour fell below the threshold. One calm winter is weather, not a trend.
The Longest Dunkelflaute Periods Since 2024: Duration, Price, Gap
The table shows the six lulls since January 2024 that lasted at least four days below the 15 percent line. Residual load is the part of consumption not covered by wind and solar, but by power plants, storage and imports.
| Period | Duration | Wind and solar share of consumption | Average price | Highest hourly price | Residual load |
|---|---|---|---|---|---|
| 3 to 14 Nov 2024 | 10.4 days | 13.0% | €144/MWh | €820/MWh | 12.3 TWh |
| 10 to 14 Dec 2024 | 4.4 days | 13.0% | €236/MWh | €936/MWh | 5.6 TWh |
| 25 to 29 Dec 2024 | 4.1 days | 15.0% | €116/MWh | €158/MWh | 3.9 TWh |
| 15 to 22 Jan 2025 | 7.4 days | 14.5% | €168/MWh | €583/MWh | 9.3 TWh |
| 12 to 16 Feb 2025 | 4.0 days | 14.5% | €156/MWh | €299/MWh | 4.9 TWh |
| 6 to 11 Nov 2025 | 4.5 days | 14.1% | €107/MWh | €179/MWh | 5.0 TWh |
| For comparison: 28 Oct to 3 Nov 2026 (20 percent line) | 5.8 days | 19.8% | €269/MWh | €560/MWh | 6.0 TWh |
The November 2024 lull was the longest at just over ten days, while the shorter December episode brought the highest hourly price: on 12 December 2024 the hour from 17:00 to 18:00 cost 936.28 euros per megawatt hour. In the 1,213 dunkelflaute hours of 2024 and 2025 the price averaged 148.78 euros, in all other hours 79.09 euros. The Bundesnetzagentur and the Federal Cartel Office found no abuse in the 2024 price spikes.
Does a Dunkelflaute Threaten a Blackout?
Going by experience so far, no. A dunkelflaute is first of all a price event, and security of supply has held in every one so far. In the most expensive hours of 2024, from 17:00 to 18:00 on 6 November and 12 December, the Bundesnetzagentur says about 4.5 and 3.4 gigawatts of market capacity were still available, plus about 12 to 13 gigawatts of reserves and balancing power; supply was secure at all times, the agency says. An analysis by the agency for the end of October 2026 is not yet available. What is certain is what ran: at peak 14.7 gigawatts of gas, 13.4 gigawatts of lignite and 5.3 gigawatts of hard coal, against 35.3, 14.8 and 15.1 gigawatts in the statistics, part of which is in reserve, under maintenance or tied to heat supply.
For security of supply in the coming years the question gets more serious. The Bundesnetzagentur calls new dispatchable capacity urgently needed, and something has just happened there. On 3 November 2026 the Bundesnetzagentur granted the first awards for new power plants: 11 of 41 bids with about 5,160 reduced megawatts, meaning firm capacity, at an average of 155,296 euros per reduced megawatt and year. According to dpa, the plants must be running by 2031 at the latest, and the awards went almost entirely to RWE and Leag. That comes to about 800 million euros a year for 15 years. Spread over the 466 terawatt hours of grid load in 2025, that would be just under 0.2 cents per kilowatt hour. The agency will announce a second round on 10 November.
What Does a Dunkelflaute Cost Households and Businesses?
That depends on the tariff. With a dynamic tariff you pay the exchange price hour by hour, with a fixed price the lull only arrives later through the supplier's purchasing costs. The table shows what the week would have cost compared with the exchange average of January to September 2026, with the price passed on in full, for even consumption and for energy only, without taxes and grid fees.
| Annual consumption | Consumption in the week | at €108/MWh | at €265/MWh | Extra cost |
|---|---|---|---|---|
| Household, 3,500 kWh | 67 kWh | €7 | €18 | about €11 |
| Small business, 100 MWh | 1.9 MWh | €207 | €508 | about €300 |
| Mid-sized company, 10 GWh | 192 MWh | €20,700 | €50,800 | about €30,000 |
For households a single low-wind week is manageable, as long as consumption can move out of the evening hours. For businesses a closer look pays off: if you know your load profile and demand charges, you can see what a peak at 17:00 costs. If you need predictable prices, hedge part of your demand long term, for example with a power purchase agreement, and keep the volume risk in mind: the lull also hits the plant behind the contract.
Solutions: What Helps Against a Dunkelflaute
Four levers work together, and none is enough on its own. The energy system of the transition needs all four.
- Firm capacity: plants that can run for days, including the new gas plants that are meant to switch to hydrogen later. They secure supply, but they do not free the price from gas.
- Power trading and grids: across Europe a lull is far rarer, the Weather Service counts 0.2 cases a year. The better the grid connects countries, the more the weather next door helps.
- Flexible consumers: dynamic tariffs reward anyone who moves a heat pump, wallbox or machines out of the most expensive hours. That lowers the peak that drives the price up most.
- Electricity storage: batteries shift power within the day and smooth price spikes. They do not last for days, as the next section shows.
Battery Storage in a Dunkelflaute: Hours, Not Days
The week's residual load added up to 7.2 terawatt hours. All batteries in Germany come to about 35 gigawatt hours according to Energy-Charts, less than one two-hundredth of that. Fully charged, they would have covered the average residual load of 43 gigawatts for about 50 minutes. A little over 70 percent of the capacity also sits in home batteries, according to RWTH Aachen's Battery Charts, which mostly store power from their own roof, and that is missing in a dunkelflaute as well. I looked at where the home storage market stands in my piece on the sonnen insolvency.
Storage shows its strength within the day. During the low-wind week the gap between the cheapest and the most expensive hour averaged 138 euros per megawatt hour. Charging at night and discharging at 17:00 takes the peak off exactly that hour. Since 21 October 2026 the MiSpeL ruling has set out how storage in direct marketing can combine market trading and self-consumption without losing the subsidy for its solar power. The details are in MiSpeL explained. What storage does for the grid beyond that is covered in Why Battery Storage Stabilises the Winter Grid.
So I would not read a dunkelflaute as a storage problem but as a question of firm capacity and the fuel behind it. Batteries take the peak off the evening, the days are carried by power plants, neighbours and demand that can shift. I collect further pieces under BESS and energy storage.
Frequently Asked Questions
Is there a dunkelflaute right now?
As of 4 November 2026 it is fading. From 28 October to 3 November wind and solar covered 22 percent of consumption, and on 4 November the forecast on SMARD showed about 17 gigawatts of wind again. The exchange price stayed high at 249 euros per megawatt hour because gas is expensive.
When was the last dunkelflaute in Germany?
The latest ran from 28 October to 3 November 2026. It meets the Bundesnetzagentur's definition and sits below a line of 20 percent wind and solar in consumption. The last lull below the stricter 15 percent line in consumption ran from 2 to 6 December 2025.
What share of German electricity is imported?
In 2025 net imports were 21.9 terawatt hours, or 4.7 percent of the 466 terawatt hours of grid load. In the low-wind week at the end of October 2026 the share was 6.7 percent. From 1 January to 3 November 2026 the balance is nearly even at minus 0.3 terawatt hours.
Where does Germany's imported electricity come from?
In the lull from 28 October to 3 November 2026 mainly from France with 354, the Netherlands with 335, Denmark with 230 and Norway with 221 gigawatt hours. At the same time power flowed on to Austria, Poland and the Czech Republic.
In which season does a dunkelflaute occur?
Mainly from November to March. Below the strict 15 percent line in consumption not a single hour has fallen between April and October since January 2024. Weaker lulls also occur in October, for example from 12 to 16 October 2025 and most recently from 28 October 2026. In summer the sun delivers enough during the day.
How long does a dunkelflaute last on average?
The eleven episodes below the 15 percent line since January 2024 lasted between just under three and just over ten days, with a median of four days. The longest ran from 3 to 14 November 2024. By the yardsticks of the Bundesnetzagentur and the German Weather Service a dunkelflaute starts at 48 hours.
What is the opposite of a dunkelflaute?
Informally the opposite is called a Hellbrise: plenty of wind, often plenty of sun too. Something similar happened just before this lull, driven mainly by wind. On 24 and 25 October 2026 renewable energy covered more than total consumption, and a megawatt hour cost a daily average of only 30 and 13 euros.
Will a dunkelflaute make my electricity more expensive?
With a dynamic tariff immediately, because it passes on the exchange price: 265 euros per megawatt hour is 26.5 cents per kilowatt hour before grid fees, levies and taxes. With a fixed price a dunkelflaute only works through the supplier's purchasing costs in later tariffs.
Best,
Dennis Weidner
Note: AI tools supported me in writing this article, and some images were edited with AI. I stand behind its content and every statement with my name.