I expected winter to be the good season for storage. The figures say otherwise: January and June 2026 had almost the same price level, but June had 2.7 times the daily spread. Batteries do stabilise the winter grid, just on a different timescale than assumed.
What Is Actually Different in Winter
The claim that battery storage stabilises the grid is easy to support in summer and hard in winter. So it is worth looking first at what actually happens between November and February, before explaining what a battery is supposed to help against.
The basis is the quarter-hourly data of the Fraunhofer Institute for Solar Energy Systems. Four months side by side, all at the same resolution:
- December 2025: solar 1,483 GWh, onshore wind 13,323 GWh, load 43,475 GWh, peak load 74,108 MW
- January 2026: solar 1,678 GWh, onshore wind 13,089 GWh, load 47,634 GWh, peak load 78,333 MW
- February 2026: solar 2,731 GWh, onshore wind 11,534 GWh, load 41,989 GWh, peak load 78,373 MW
- June 2026: solar 11,460 GWh, onshore wind 6,507 GWh, load 38,098 GWh, peak load 67,044 MW
June delivers roughly eight times the December sun, 11,460 against 1,483 gigawatt-hours, a factor of 7.7. At the same time the February peak load sits almost 17 percent above the June figure. That is the winter situation in two numbers: less sun, more demand, and the balance is carried by wind, which fed in around twice as much in December as in June.
The values show public net electricity generation. Rooftop solar consumed in the same building does not appear in them. The solar figure is therefore a lower bound, and the load is grid load, not total consumption.
The Order of Magnitude That Frames Everything Else
The Federal Network Agency reports that as of 15 October 2025, large-scale battery storage in Germany with roughly 2.4 gigawatts of gross capacity and a usable energy capacity of roughly 3.2 gigawatt-hours is in operation. Anything above 999 kilowatts of gross capacity counts as large-scale.
Three figures put that in context:
- 3.2 GWh divided by the peak load of 78,373 MW gives about two and a half minutes. That is how long all German large-scale batteries together could carry a winter evening peak, assuming they were full and nothing else was running.
- 3.2 GWh divided by 2.4 GW gives a storage duration of one hour and twenty minutes at full output. That is the design, not a defect: these plants are built for short, frequent cycles.
- 2.4 GW measured against the same peak load is 3.1 percent.
Anyone talking about battery storage as a winter reserve is describing a plant that does not exist. A dark doldrums lasts days. The entire German large-scale fleet carries minutes. Three orders of magnitude sit between those, and no subsidy closes that gap within one winter.
That does not argue against the technology; its contribution simply lies elsewhere.
The Finding I Did Not Expect
I came to this subject with an expectation: in winter power is expensive and prices are volatile, so winter must be the good season for a battery that charges cheap and discharges dear. The figures say the opposite.
A battery does not earn from the price level but from the spread within a day. The average daily spread is the difference between the highest and the lowest day-ahead price of a day in the German and Luxembourg zone, averaged over the month, in each case from quarter-hourly values:
- January 2026: mean 110.09 euros per MWh, average daily spread 89.14 euros
- June 2026: mean 109.52 euros per MWh, average daily spread 240.12 euros
Two months with almost identical price levels, the difference being less than one percent. And between them a daily spread differing by a factor of 2.7. December 2025 and February 2026 fit the pattern: average spreads of 77.13 and 78.85 euros, against 207.94 euros in May 2026.
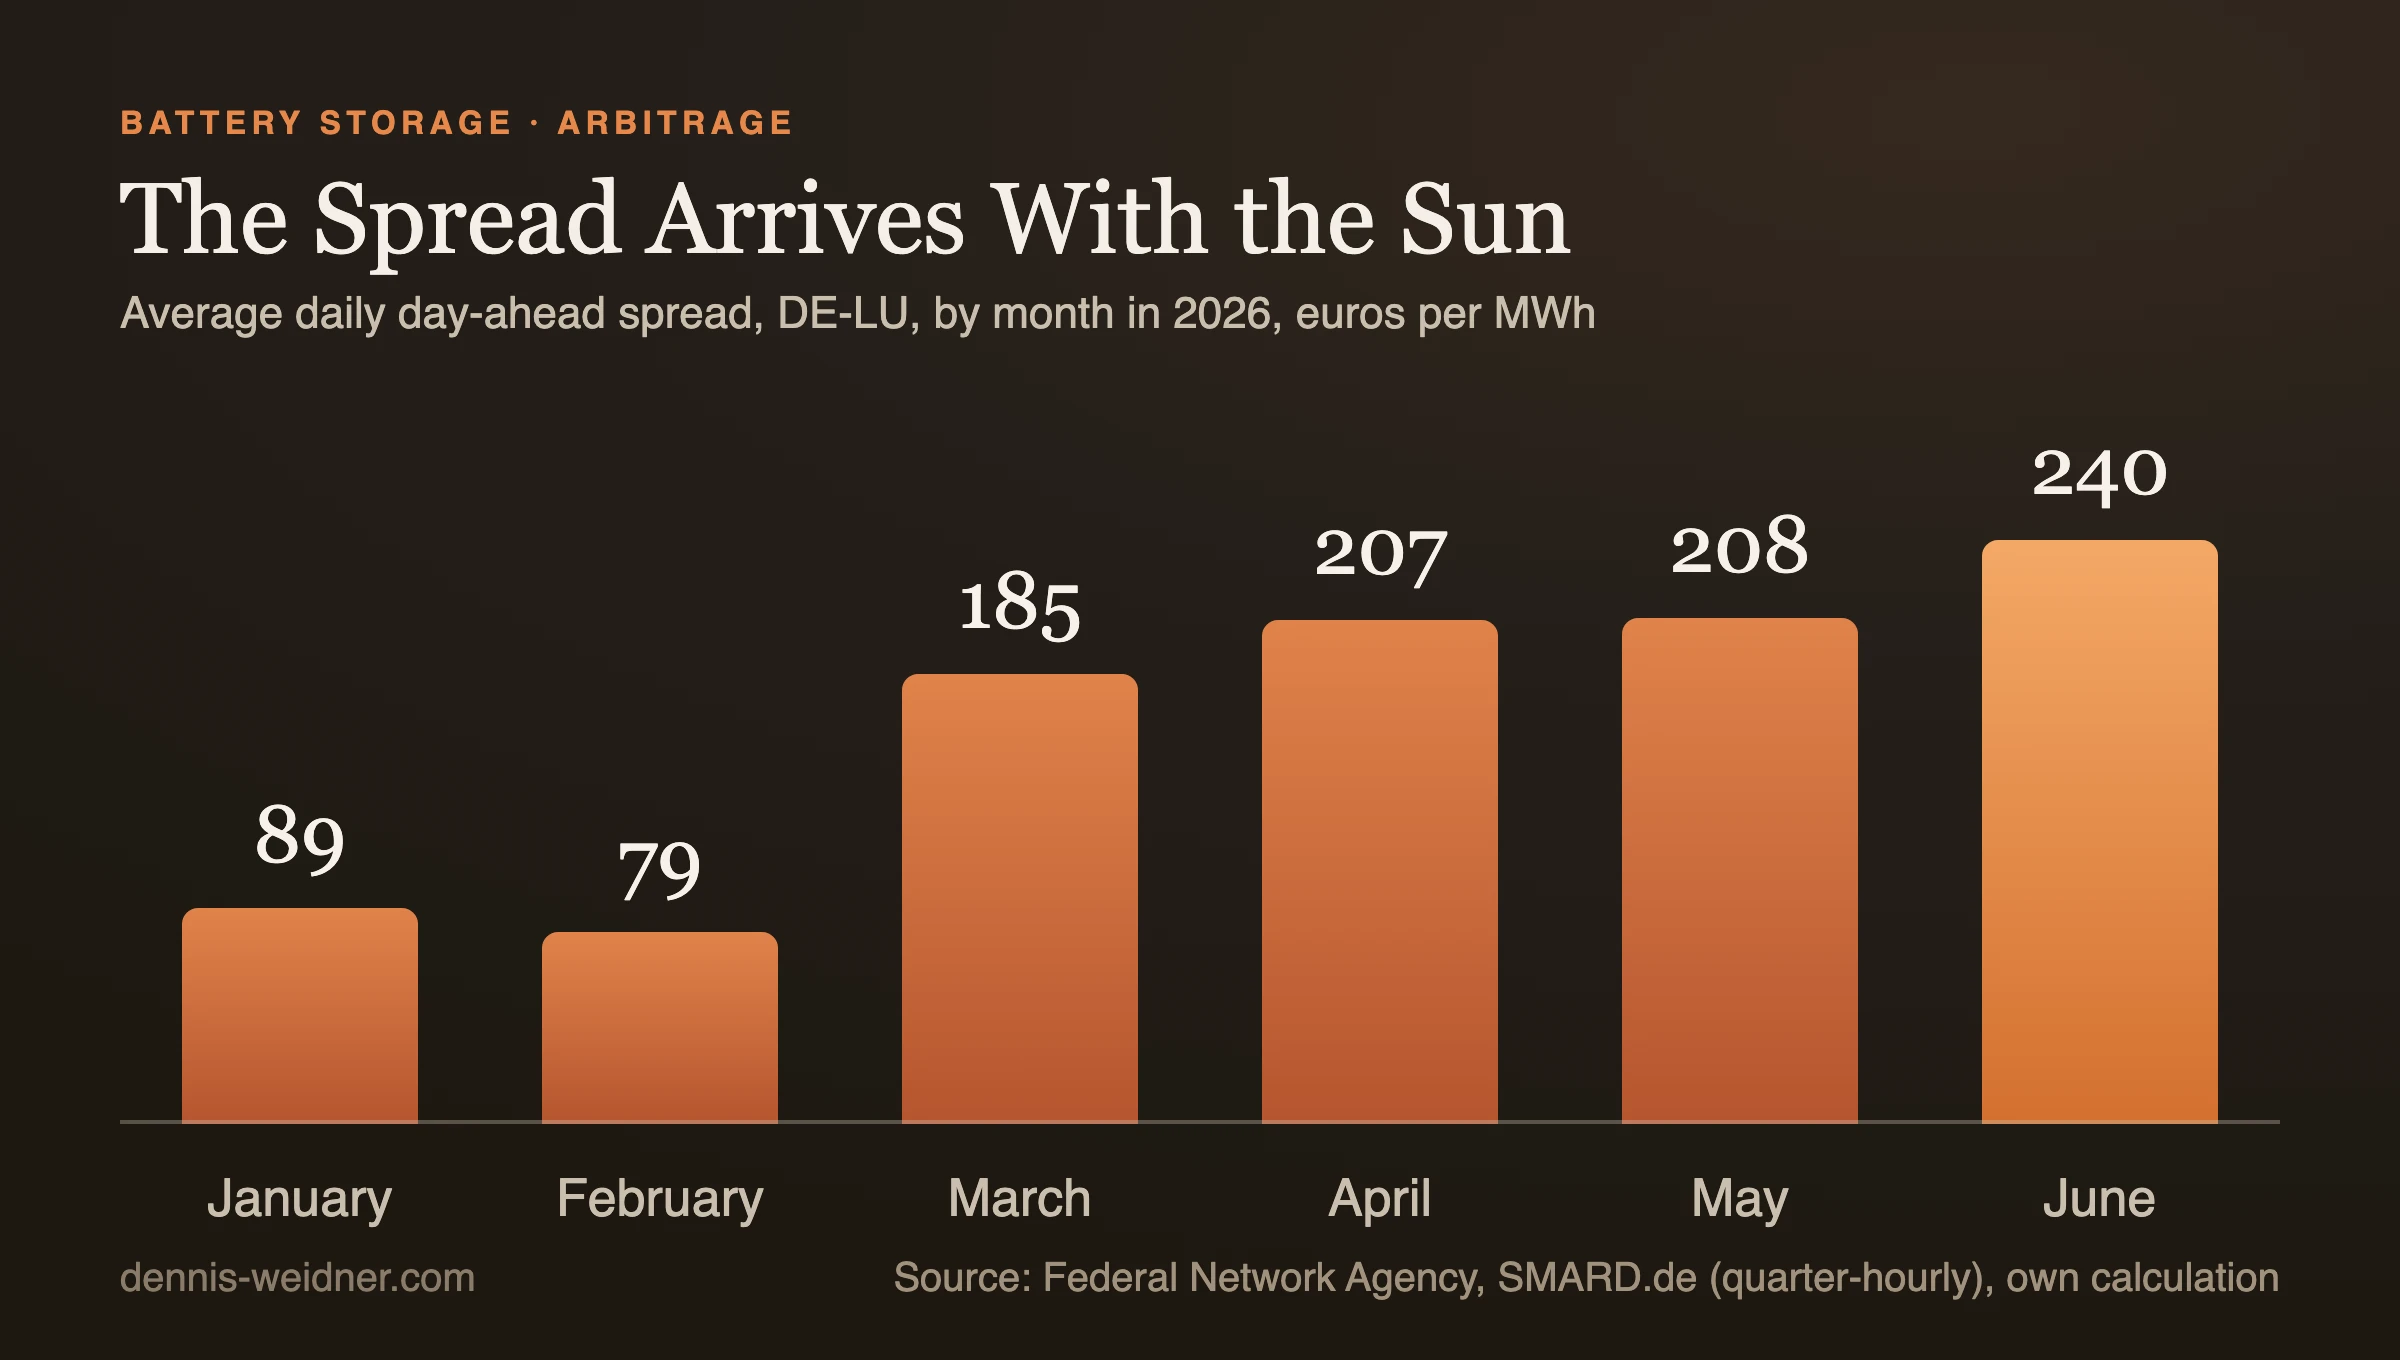
For a pure arbitrage battery, winter is the worse season, even though power is expensive. That runs against intuition and has a simple cause.
The Spread Comes From the Sun, Not the Cold
Price differences within a day arise where a large volume of electricity meets a market at midday that does not need it. Photovoltaics does that, and only in summer. On 8 January 2026 the Federal Network Agency reported installed solar capacity of 117 gigawatts at the end of 2025, after 16.4 gigawatts were added in 2025 alone. In June 2026 the solar peak reached 54,726 megawatts, in December 2025 it was 17,633.
What that turns into on the price side can be counted. Quarter-hours with a negative day-ahead price, meaning periods in which offtake was paid for:
- December 2025: 0
- January 2026: 10
- February 2026: 23
- May 2026: 315
- June 2026: 199
The ratio is unambiguous and explains the spread completely. In summer there is a daily trough a battery can charge into. In winter there is none, because the sun does not push the price down. The revenue of an arbitrage battery depends on photovoltaics, not on the price of electricity. Building a revenue model on winter prices means building on the wrong driver.
What Winter Delivers Instead: Height, Not Spread
Back to the question in the headline. Winter does not deliver spread, it delivers height, and height is a capacity problem, not an energy problem.
Residual load, meaning the part of demand that dispatchable generators must cover after wind and solar are subtracted, reached a maximum of 68,545 megawatts in December 2025. In June 2026 it was 56,041. That is a good 22 percent more. In winter the system therefore stands closer to its limit, and there every plant that goes from zero to rated output within seconds counts.
In this discipline a battery has no competition. A gas plant needs minutes, a pumped hydro station roughly a minute, a battery one second. When a generating block trips or a wind forecast misses, what matters is not the stored volume but the time to full output. On that timescale, 2.4 gigawatts is a noticeable contribution.
Even in December 2025 residual load fell to a minimum of minus 4,207 megawatts. So even in midwinter there were quarter-hours of surplus in which a battery could fill up. They are simply rare and unpredictable, and a battery has to be empty when they occur.
Where the Bottleneck Actually Sits
If batteries work through capacity in winter, the obvious conclusion is to build more of them. A great many people are trying to do so.
The Federal Network Agency reports that at the end of 2024 the transmission system operators held around 650 grid connection requests for large-scale batteries with a combined capacity of 226 gigawatts. In operation, as of 15 October 2025, were 2.4 gigawatts. The same source reports 5.0 gigawatts with 10.4 gigawatt-hours in planning.
Two figures on that. First, the queue is about 94 times the installed base. Second, and this is often overlooked: that is almost three times the German peak load, measured against the 78,373 megawatts of February 2026.
A request list amounting to three times peak load is not a build plan. It is a list of intentions, in which the same sites are registered more than once, projects are requested twice and options are held open, because a request is cheap and secures a place in the queue. Reading those 226 gigawatts as a coming fleet reads them wrongly. What they reliably show is that the bottleneck is not the battery but the grid connection.
The regulatory side of this question, meaning how storage and charging points enter the market at all, I wrote up separately in the German storage market integration rules. The overall picture on storage projects is on my topic page on BESS and energy storage.
What I Take From This for Projects
Three points, and they change the order in which I assess a storage project.
First, revenue depends on the spread, not on the price level. A model built on the annual average power price measures the wrong quantity. January and June 2026 were less than one percent apart in the mean and carried entirely different businesses. The right input is the daily spread, resolved by month, and its driver is photovoltaics.
Second, winter pays through capacity, not through energy. Anyone justifying the winter contribution should argue with response time and reserve provision. That is also the more honest story, because it survives the follow-up question of how long the plant bridges a dark doldrums. Answer: it does not, and that is not its job.
Third, the grid connection is the schedule. Between 2.4 gigawatts installed and 226 gigawatts requested lies a queue. The factor of 94 says nothing about the market and everything about the bottleneck. In every project timeline I see, the connection is the longest bar, and it is the only one that cannot be shortened with more capital.
Frequently Asked Questions
How much battery storage is installed in Germany?
As of 15 October 2025 the Federal Network Agency reports large-scale batteries with roughly 2.4 gigawatts of gross capacity and roughly 3.2 gigawatt-hours of usable energy in operation, plus around 5.0 gigawatts with 10.4 gigawatt-hours in planning. Anything above 999 kilowatts of gross capacity counts as large-scale.
Can battery storage bridge a period of low wind and sun?
No, and not by orders of magnitude. 3.2 gigawatt-hours of usable capacity cover the winter peak load of 78,373 megawatts for about two and a half minutes. A dark doldrums lasts days. These plants are built for short, frequent cycles, with a storage duration of about one hour and twenty minutes.
Do batteries earn more in winter than in summer?
Not according to day-ahead prices. January 2026 and June 2026 averaged 110.09 and 109.52 euros per megawatt-hour, essentially level. The average daily spread, from which a battery draws its revenue, was 89.14 against 240.12 euros. That is a factor of 2.7 in favour of summer, because midday photovoltaics creates the daily price trough.
Why do batteries stabilise the grid in winter, then?
Because in winter it is not energy that is scarce but capacity at the right moment. Residual load peaked at 68,545 megawatts in December 2025 against 56,041 in June 2026. On the timescale of seconds to minutes a battery is unmatched in speed, and that is exactly where system stability is decided.
What do the 226 gigawatts of connection requests mean?
They are not a build forecast. At the end of 2024 transmission system operators held around 650 requests with that combined capacity, while 2.4 gigawatts were in operation. That is roughly 94 times the installed base and almost three times German peak load. Such lists contain duplicate requests and options held open. What they mainly show is that the grid connection is the bottleneck.
Where do the generation and price figures in this article come from?
From energy-charts.info of the Fraunhofer Institute for Solar Energy Systems, based on the quarter-hourly values as of 25 September 2026. The values show public net generation, so rooftop self-consumption is not included. Only months at the same time resolution are compared.
Warm regards,
Dennis Weidner
Note: AI tools supported me in writing this article, and some images were edited with AI. I stand behind its content and every statement with my name.