On 3 November 2026 the United States elects a new House of Representatives and a third of the Senate. In the weeks before, every market commentary will explain what this means for prices. The historical numbers on the subject are clearer than you would expect, and they are still worth less than they appear to promise. Both facts matter, and I write this as someone who ran a financial publication for years and watched from close range what dates like this do to people's need for explanation.
The pattern everyone will quote
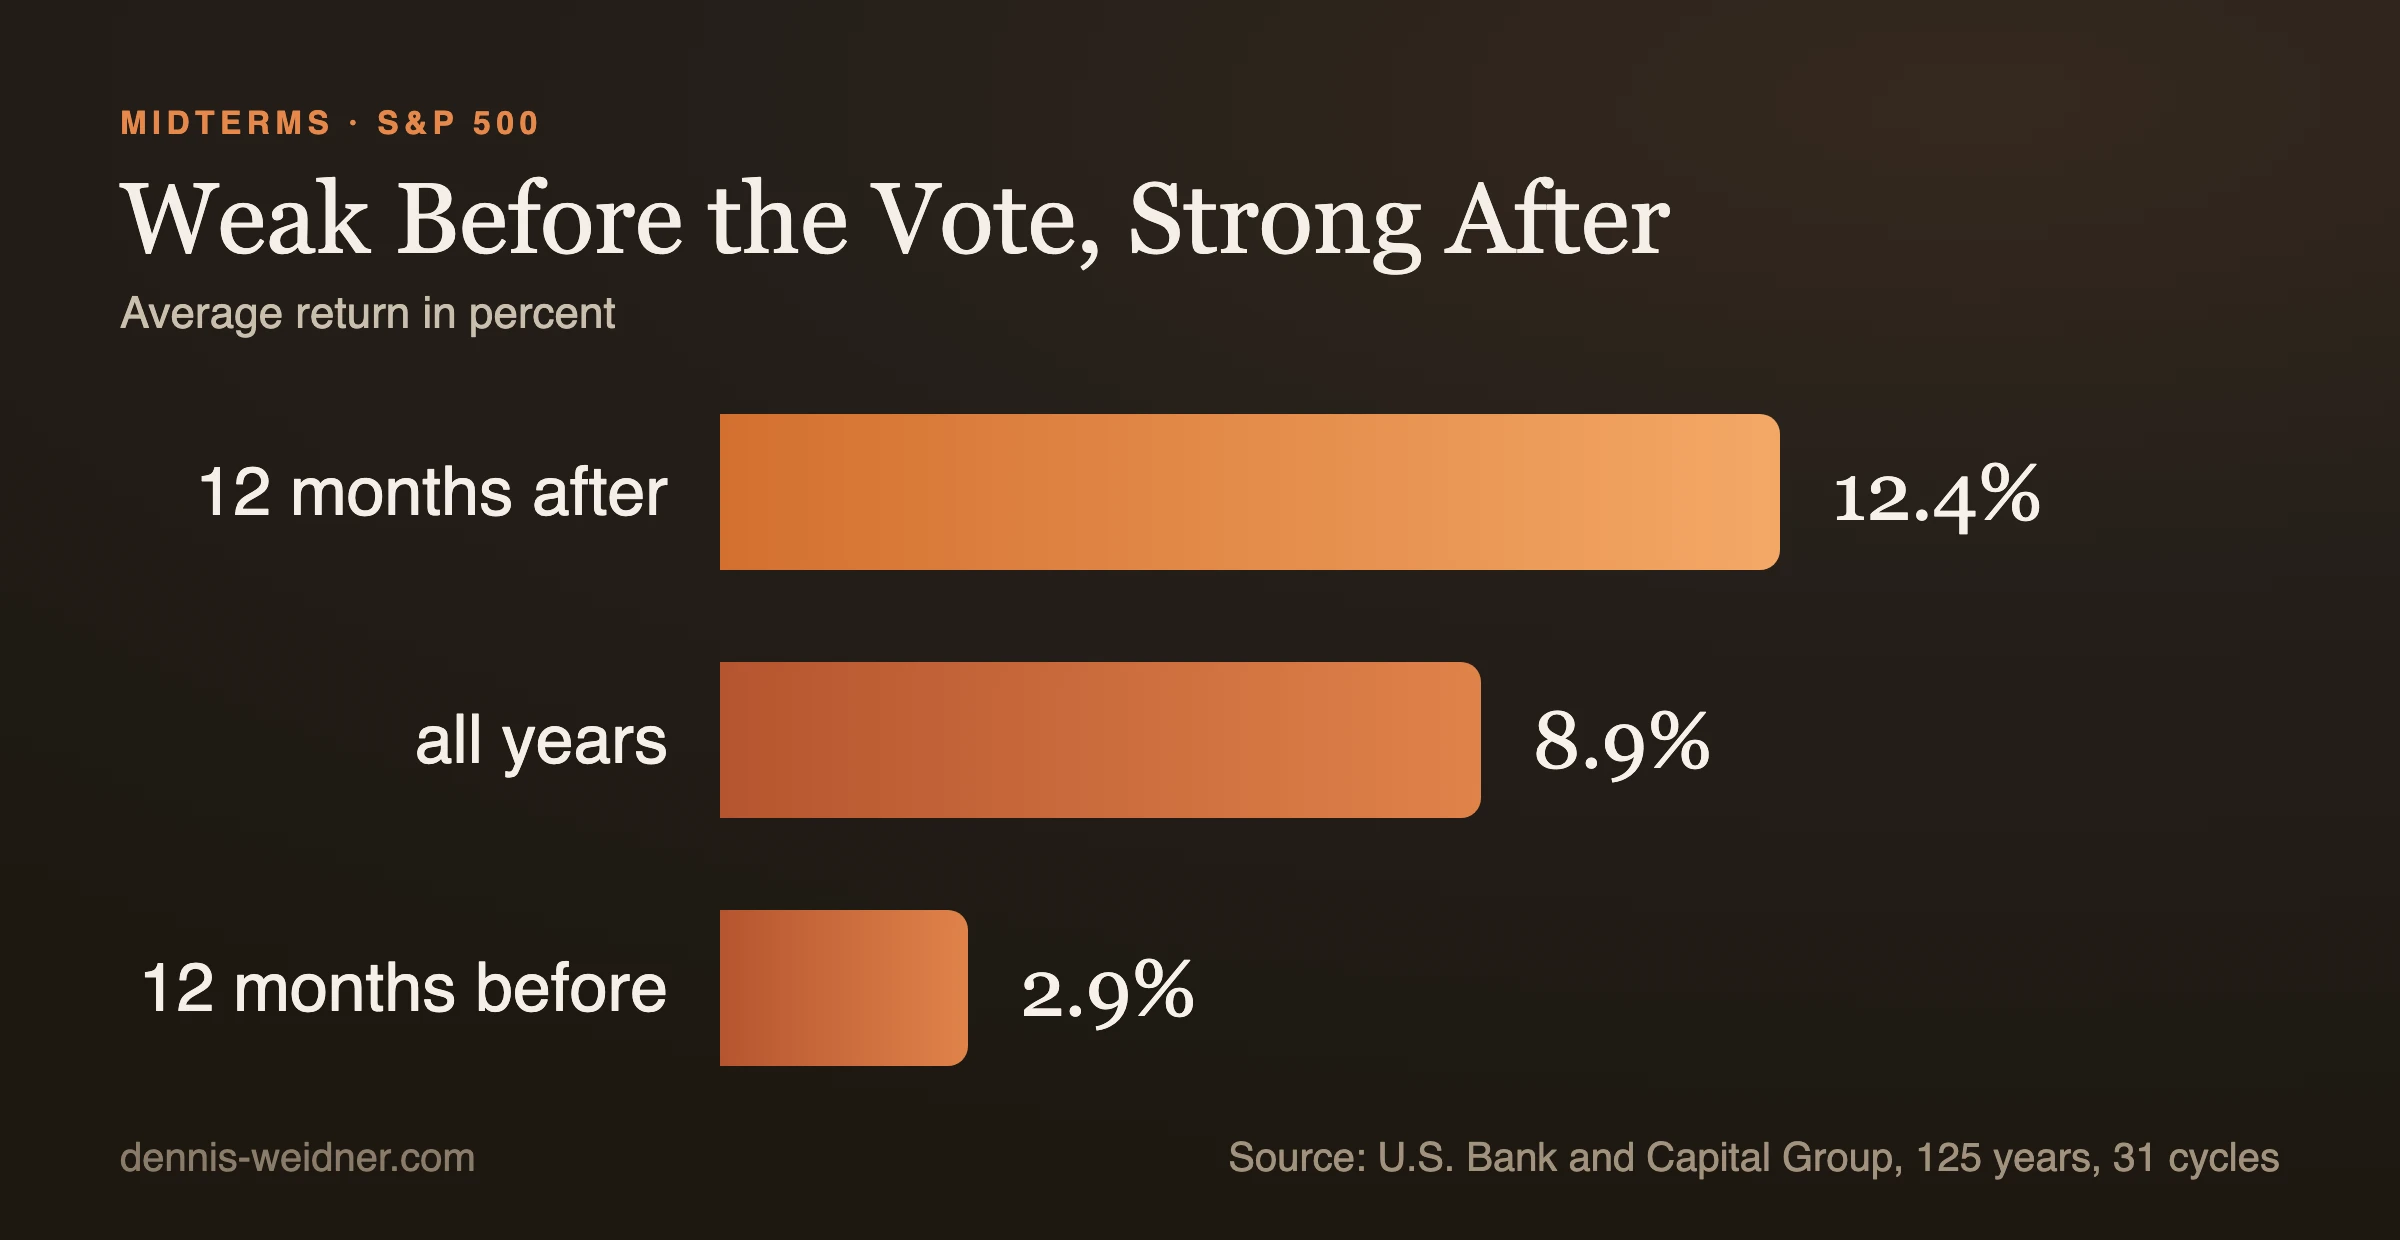
It is genuinely there. In the twelve months before US midterm elections the S&P 500 has returned an average of 2.9 percent, against 8.9 percent across all years. In the twelve months after the vote, across 31 cycles and 125 years, the figure is 12.4 percent. Looking only at the period since 1980, the post-election number rises to around 17.5 percent. The fourth quarter of a midterm year stands out too, averaging over 5 percent from the start of October.
More on this topic: Finance & Crypto Assets, with background, practice and every article in one place.
You can build a nice story out of that. It goes like this: before the vote there is uncertainty about future policy, investors hold back, prices tread water. After the vote the uncertainty is gone regardless of the outcome, and the market catches up. The story is plausible, it sounds good, and it has a catch.
Why I do not trust the pattern
The catch is those 31 cycles. It sounds like a lot because 125 years sounds like a lot. Statistically, 31 observations is a small sample, and it contains two world wars, the Great Depression, the oil shock, the dot-com crash, the financial crisis and a pandemic. Each of those falls somewhere in an election year or the year after, and none of them has anything to do with midterms.
The serious analyses say so themselves, incidentally. The historical gap does not establish causation, and the pre-election phase is not a signal to move in and out of the market. That sentence appears in the sources and is almost always dropped from the summaries, because it ruins the punchline.
There is a second objection I consider more important. A pattern everybody knows is no longer an edge. If every market participant really knows that markets tend to rise after midterms, then that is already in the price before the vote takes place. What happens afterwards depends not on the pattern but on how the result deviates from expectations.
What the comparison with presidential years shows
It is worth holding the pattern against its own yardstick. The 2.9 percent before midterms sits against 8.9 percent across all years. So the gap is not small. It just carries an explanation that rarely comes with it.
The second year of a term is structurally the year in which the decisions with the largest side effects get made. Room for manoeuvre is greatest right after an election and smallest right before the next one. Whatever uncomfortable measures an administration intends arrive in this window, and markets react to measures, not to calendars. Part of the weak pre-election return is therefore probably not an election effect at all, but the effect of what is politically possible in that window.
The strong return afterwards has an equally unspectacular reading. Measuring twelve months after a midterm means measuring, to a considerable extent, the year before a presidential election. In that year an administration wants good numbers and avoids anything awkward. So the comparison is not election against no election, it is a politically hard phase against a politically soft one.
What is actually on the ballot in 2026
So that the assessment does not stay abstract, the starting position in numbers, as of 27 September 2026.
All 435 seats in the House are up, along with 35 of the 100 Senate seats including special elections in Florida and Ohio, plus 36 governorships. Of those 35 Senate seats, 22 are currently held by Republicans. The Senate stands at 53 to 47. In the House, according to the Clerk of the House, Republicans hold 218 seats and Democrats 214, plus one independent and two vacancies. For a Senate majority the Democrats would need a net gain of four seats.
How likely each majority is gets recalculated every day by forecasting models and betting markets. Their figures will shift by election day, and anyone reading them should always read the date alongside. I deliberately give no number here, because it would already be out of date on the day this appears.
For markets, the dullest configuration would also be the most comfortable one: divided majorities. Large legislative packages then become less likely. Historically that is not a bad environment for equities, because it means predictability, even if politically it reads as gridlock.
What running a publication taught me about dates like this
Now the part that genuinely interests me, and it has less to do with markets than with people.
I ran a publication covering crypto and finance for years. The most reliable observation from that time is this: the demand for interpretation peaks exactly when interpretation is least possible. In the hours around a big event everyone wants to know what happens now, and in precisely those hours nobody knows. Whoever delivers then gets the attention. Whoever waits until they actually know something does not.
That is a remarkably unpleasant incentive, and it explains a good share of what you will read in October and November. It is rarely malice. It is the structure of the business.
For this site I turned that into a rule I genuinely keep: news may change the schedule, but not the standard. When a topic has a live news hook it moves to the front, and everything else moves back if necessary. What does not happen is a piece without a number of its own, merely because the date happens to be convenient. This article is a test case for that itself: it appears a week before the vote and deliberately contains no forecast of where prices will go. It contains what the data says, and what it does not.
Where the result actually reaches me
And then there is the level on which a US election lands in my working life very concretely, without any share price being involved.
A large part of my work sits in the energy business, specifically battery storage. The cells for it come overwhelmingly from Asia. What an American administration does on trade policy changes cell prices, lead times and hedging costs worldwide, including for a project in Brandenburg. That is a far more direct connection than any statement about the S&P 500, and election coverage practically never makes it.
So on an election night I do not watch index levels. I watch the composition of the committees that decide on tariffs and subsidy programmes. For the economics of a storage project running twenty years, that is the information that counts. Why those projects hinge on entirely different questions anyway is set out in my overview of BESS and energy storage.
My rule for election weeks
Three sentences that have held for years.
One: no portfolio gets rebuilt because of a date that is in the calendar. What is scheduled is known, and what is known is in the price. Reacting pays off for surprises, not for appointments.
Two: the interesting question is not who wins, but what of it ends up in legislation. Between an election result and a statutory text lie months, committees and compromises. That is where the effects that actually change a business are made.
Three: anyone reading a confident forecast in October is not reading analysis, they are reading a product. That applies to articles, to videos, and explicitly to mine as well.
What I do instead is unspectacular and has served me well. Before the event I write down which outcome would surprise me and what I would do about it. Two sentences, no more, but beforehand. Afterwards it becomes impossible: once you know how it turned out, you reliably find a reason why you saw it coming. The note written in advance is the only way to check your own judgement honestly.
For this election my note has exactly one line on it: a result that produces clear majorities in both chambers would surprise me, because it would make large legislative packages possible again, including in trade policy, which matters directly for my supply chains. Everything else is priced in, including my own shrug.
Frequently Asked Questions
When are the 2026 US midterm elections?
On 3 November 2026. All 435 House seats are up, along with 35 of the 100 Senate seats including special elections in Florida and Ohio, and 36 governorships.
How do equity markets behave around midterms?
Historically weak before and strong after. In the twelve months before the vote the S&P 500 returned an average of 2.9 percent, against 8.9 percent across all years. In the twelve months after, across 31 cycles, the figure is 12.4 percent, and around 17.5 percent for the period since 1980.
Can you build an investment strategy on that?
The sources themselves advise against it. The historical gap does not establish causation, and 31 cycles is a small sample containing two world wars, several crises and a pandemic. On top of that, a pattern everybody knows is already reflected in prices.
What are the majorities going into the vote?
As of 27 September 2026 the Senate stands at 53 to 47. In the House, Republicans hold 218 seats and Democrats 214, plus one independent and two vacancies. For a Senate majority the Democrats would need a net gain of four seats.
What do divided majorities mean for markets?
Large legislative packages become less likely. Historically that is not a bad environment for equities because it means predictability, even if it is perceived politically as gridlock.
This text is a personal assessment, not investment advice. It contains no recommendation to buy or sell any particular security.
Warm regards,
Dennis Weidner
Note: AI tools supported me in writing this article, and some images were edited with AI. I stand behind its content and every statement with my name.